If your team struggles to connect day-to-day work with high-level business goals, a KPI tree can help.
A KPI tree (also known as a performance hierarchy or metrics cascade) breaks down your big-picture objectives into smaller, measurable indicators. It’s a powerful way to align teams, improve focus, and drive better performance.
In this guide, we’ll show you how to build one for your business step by step.
What Is a KPI Tree?
A KPI tree is a visual tool that connects your main strategic goal (at the top) to smaller objectives and key performance indicators (KPIs) beneath it.
It shows how each activity or outcome contributes to the bigger picture. Think of it like a family tree for your metrics.
Why Use a KPI Tree?
- Clarity – It shows everyone how their work supports larger goals.
- Focus – Keeps teams from chasing irrelevant metrics.
- Alignment – Ensures all levels of the organization are working toward the same outcomes.
- Performance – Helps identify gaps or weak links in your strategy.
Step-by-Step: How to Build a KPI Tree
Step 1: Start with a Strategic Goal
Begin with one clear, high-level goal. This could be:
- Increase revenue by 20%
- Improve customer satisfaction
- Expand market share
This becomes the top of your KPI tree.
Step 2: Identify Supporting Objectives
Next, break that goal down into 2–4 strategic objectives that contribute to it.
Example for “Increase revenue”:
- Grow new customer acquisition
- Increase average order value
- Reduce churn rate
Step 3: Define KPIs for Each Objective
For each objective, identify 1–3 KPIs that can measure progress.
Example for “Grow new customer acquisition”:
- Number of new leads per month
- Lead-to-customer conversion rate
Make sure each KPI is:
- Specific
- Measurable
- Actionable
- Regularly updated
Step 4: Link Operational Metrics (If Needed)
In some cases, you can break KPIs down further into team-level or task-level metrics.
Example:
- For “Lead-to-customer conversion rate,” you might track:
- Response time to new leads
- Number of follow-ups per lead
These lower-level metrics help teams know exactly what to focus on.
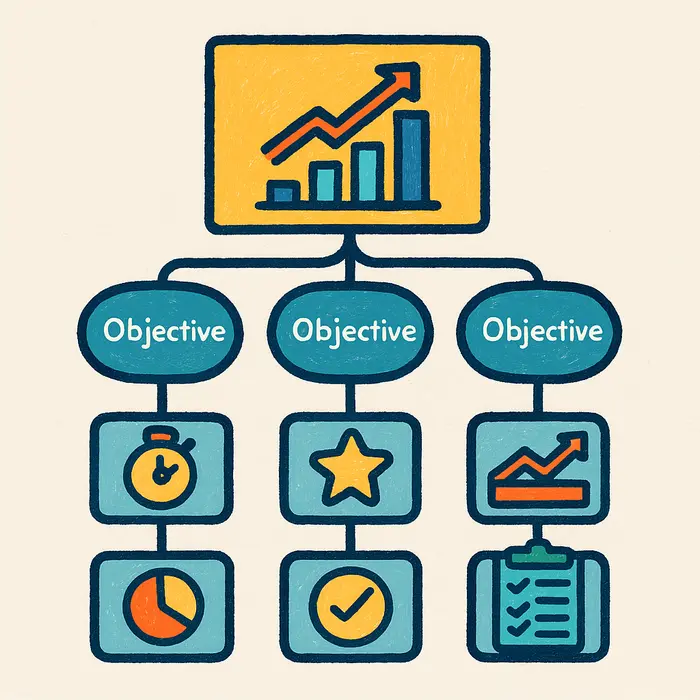
Step 5: Draw the Tree
Use a simple diagram:
- Top: Strategic goal
- Middle: Objectives
- Bottom: KPIs (and optionally sub-KPIs)
Tools like PowerPoint, Lucidchart, or Miro work well. Even sticky notes on a whiteboard can do the trick.
Step 6: Share and Review Regularly
Make the KPI tree visible and part of regular reviews:
- Monthly performance check-ins
- Quarterly strategy updates
Adjust as needed when goals or data evolve.
Example KPI Tree
Goal: Improve Customer Satisfaction
- Objective 1: Reduce support response time
- KPI: Average first response time (hrs)
- KPI: % of tickets responded to within 4 hours
- Objective 2: Increase resolution quality
- KPI: Customer satisfaction score (CSAT)
- KPI: % of tickets resolved on first contact
- Objective 3: Improve onboarding experience
- KPI: Net Promoter Score (NPS) within 30 days
- KPI: % of customers completing onboarding tasks
Pro Tips
- Don’t overload each branch—2–3 KPIs per objective is plenty.
- Use plain language. Everyone should understand what each metric means.
- Focus on influence. If a team can’t influence a KPI, it’s not useful to them.
Summary: Align Everyone, Improve Everything
A KPI tree helps teams see how their actions connect to strategy. It brings clarity, direction, and motivation to the numbers.
Start with one goal. Build out the layers. Share it widely. And use it to guide action, not just track activity.